
使用自動化的微流控芯片系統在單細胞中檢測MicroRNA的異質性
編輯推薦:
Fluidigm 公司開發了一種在C1TM單細胞自動制備系統及BiomarkTM HD系統上檢測單細胞miRNA表達譜的實驗方案。此方案可以在小于24小時的時間內,平行處理96個單細胞,在一張GE 96.96芯片對每個單細胞分別檢測多達96種miRNA。配套的SINGuLAR™ 2.0分析軟件可以對數據進行非監督式聚類分析及PCA分析,有效的根據miRNA表達類型在單細胞水平揭示細胞群體的異質性,為研究miRNA調控提供更多數據。
使用自動化的微流控芯片系統在單細胞中檢測MicroRNA的異質性
Leyrat Anne, Shuga Joe, Li Nianzhen, Szpankowski Lukasz, Unger Marc & West Jay
(ISSCR 2013 poster: F-3201)
介紹
MicroRNA (miRNAs)是一類短小(18-24個核苷酸)的非編碼RNA,它們可以通過破壞信使RNA(mRNA)的穩定性和抑制mRNA翻譯來調控基因表達。細胞群體中miRNA的表達通常認為可以驅動下游基因表達和蛋白功能。我們的目的是使用一種微流控系統在單細胞水平確定miRNA表達的變化,這種系統可以自動化的將單細胞捕獲及miRNA預擴增以便進行后續表達分析。我們開發了一種簡單、模塊化的流程,可以將對細胞群體的分析輕松降至單細胞水平(圖1)。此流程包括兩個核心部件:C1TM單細胞自動制備系統(圖1a:樣本制備,包括細胞分離和從miRNA制備cDNA)和動態芯片(Dynamic Array™ IFC)及BiomarkTM HD系統(圖1b:讀出,高度平行的表達分析)。對C1TM芯片捕獲的每個單細胞進行的目標特異性擴增(Specific Target Amplification, STA),借用了Single Cell-to-Ct™試劑盒(Life Technologies)完成裂解及預擴增步驟,以及TaqMan® MicroRNA Reverse Transcription 試劑盒(Life Technologies)完成逆轉錄步驟(圖2)。
使用動態芯片及BiomarkTM HD系統,可以使用96對microRNA TaqMan表達引物,平行分析從96個單細胞預擴增所得的96個cDNA樣本。使用Fluidigm SINGuLAR™ 2.0分析軟件對數據進行主成分分析(Principal Component Analysis,PCA),揭示了從單一表型所得的一群單細胞中miRNA表達的顯著變化(圖3,4,5)。比較不同表型的細胞群體(人類胚胎成纖維細胞,人類誘導多能干細胞(iPS),從iPS所得人類神經祖細胞(NPC),以及完全分化的人類神經元(HN)),除同一類細胞之間表達的異質性外,展示了(不同類型細胞間)更巨大的差異。
結果
圖1. 在單細胞進行miRNA分析的整合流程
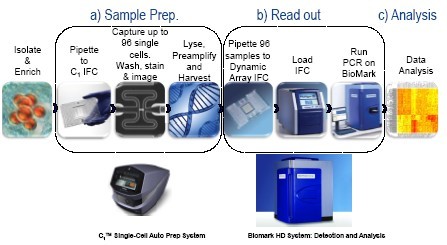
C1單細胞自動制備系統使用Life Technologies 開發的試劑和實驗方法(“Single-cell MicroRNA expression analysis”),對單細胞中的miRNA轉錄本進行目標特異性擴增(STA)。從將細胞懸液加至C1芯片到完成數據分析的整個流程,可以在不到24小時內完成。
圖2. C1 MicroRNA STA實驗流程
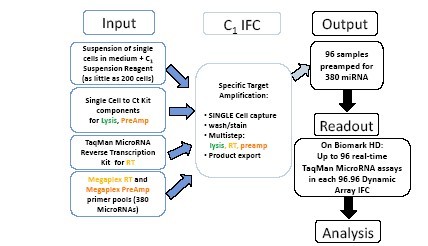
單細胞懸液(200-1000個細胞)被加入C1 IFC芯片的細胞進樣孔。使用來自Single Cell-to-Ct™試劑盒(Life Technologies)的裂解和預擴增試劑,以及來自TaqMan® MicroRNA Reverse Transcription 試劑盒(Life Technologies)的逆轉錄試劑,進行逆轉錄(使用MegaplexTM RT pool)和預擴增(使用MegaplexTM PreAmp pool),以便可以檢測每個單細胞中多達380種miRNA的表達。C1 IFC捕獲單細胞,然后沖洗,裂解,在反應倉平行對每個單細胞的miRNA進行逆轉錄和預擴增。96個預擴增過的樣本然后被導出,使用Biomark HD系統在一塊96.96動態芯片運行,研究每個樣本中多達96種miRNA的表達。
圖3. 分析:單個iPS細胞及其NPC后裔
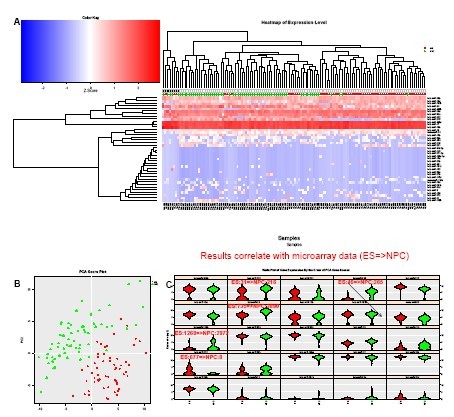
(A) 對數據進行非監督式聚類分析可以清楚的區別開iPS細胞及使用小分子從iPS獲得的NPC后裔1. 同時揭示了每種細胞中的亞群。
(B) PCA清楚的揭示了這兩種表型不同的細胞群之間的差異。
(C) Violin Plot顯示了不同亞群中miRNA 的差異性表達,以及主成分1和2的主要貢獻者(左上至右下的順序)。iPS和NPC之間5種miRNA的表達變化,和使用microassay從胚胎干細胞(ES)及其NPC后裔得到的趨勢相同(未發表數據,Yao Shuyuan友情提供)。
圖4. 人類神經元,iPS和NPC細胞

(A) 對從iPS,NPC和成熟神經元(HN)獲得的數據進行非監督式聚類分析,可以清楚的將HN細胞從iPS和NPC細胞區分開,同時也揭示了每類細胞中存在的亞群。miR-9更頻繁且更高水平的在成熟神經元(HN)中表達。
(B) 根據miRNA表達,PCA可以清楚的區分這三類細胞。miR-20a,19b,17,和106a在HN中表達水平較低,符合基于神經分化和衰老數據的預期2,3。
圖5. 不同傳代數的胚胎成纖維細胞
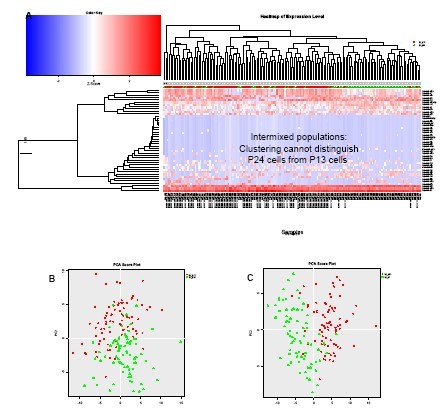
(A) 對從兩個不同傳代數(P13和P24)獲得的BJ胚胎成纖維細胞得到的數據進行非監督式聚類分析,雖然可以揭示不同細胞間miRNA表達類型的不同,卻無法區分這兩種群體。
(B) 對從P13和P24細胞得到的miRNA表達數據進行PCA分析,進一步確認無法根據miRNA表達區分這兩群細胞。
(C) 當傳代數相距更遠(P7 對P24),對miRNA數據(熱圖未顯示)進行PCA分析可以區別他們。
結論
· 我們在C1TM單細胞自動制備系統開發了一種簡潔的實驗方案,能以最少的手工操作,在不到24小時內,平行處理高達96個單細胞,對其miRNA表達譜進行分析。
· C1 miRNA STA實驗方案使用了Life Technologies為miRNA優化過的試劑。特別的,Megaplex™ RT及PreAmp pool可以從C1 IFC上每個單細胞獲得多達380種不同miRNA的cDNA。使用Biomark系統,在96.96 GE動態芯片可以讀出表達類型。
· 對來自不同類型細胞的數據進行非監督式聚類分析及PCA分析,揭示了不同類型細胞之間、或者同一類型細胞中miRNA表達類型的差異(被microarray或者文獻所證實)。
參考文獻
1. Chambers SM, et al. (2009) Highly efficient neural conversion of human ES and iPS cells by dual inhibition of SMAD signaling. Nat Biotechnol. 27(3), 275-280.
2. Trompeter H-I, Abbad H, Iwaniuk KM, Hafner M, Renwick N, et al. (2011) MicroRNAs MiR-17, MiR-20a, and MiR-106b Act in Concert to Modulate E2F Activity on Cell Cycle Arrest during Neuronal Lineage Differentiation of USSC. PLoS ONE 6(1): e16138. doi:10.1371/journal.pone.0016138
3. Hackl M., Brunner S., Fortschegger M., Laschober G.T., Micutkova L., et al. (2010), miR-17, miR-19b, miR-20a, and miR-106a are down-regulated in human aging. Aging Cell, 9(2), 291-296.
Detection of MicroRNA Heterogeneity in Single Cells Using an Automated
Introduction
Introduction
MicroRNA (miRNAs) are short (18–24 nucleotides), non-coding RNAs that regulate gene expression by both disrupting messenger RNA (mRNA) stability and inhibiting mRNA translation. The expression of miRNA species in cellular populations is thought to drive downstream gene expression and protein functionality. Our goal was to determine the variability in miRNA expression at the single cell level using a microfluidic system which automates single cell capture and miRNA pre-amplification for downstream expression analysis. We have developed a simple, modular workflow for streamlined analysis of cell populations down to the single-cell level (Figure 1). The workflow is centered on two key components: the C1TM Single Cell Auto Prep System (Figure 1a: Sample Prep, including cell isolation and cDNA preparation from miRNA species) and the Dynamic Array™ IFC and BiomarkTM HD System (Figure 1b: Read out, for highly parallel expression analysis). The Specific Target Amplification (STA) chemistry performed on each individual cell captured on the C1TM IFC borrows components from the Single Cell-to-Ct™ kit (Life Technologies) for the lysis and preamplification steps and components from the TaqMan® MicroRNA Reverse Transcription Kit (Life Technologies) for the Reverse Transcription step (Figure 2).
Using the Dynamic Array IFCs and the Biomark HD System, up to 96 cDNA samples preamplified from the 96 single cells are each analyzed in parallel with up to 96 microRNA TaqMan expression assays. Principal Component Analysis (PCA) of the data using Fluidigm’s SINGuLAR™ Analysis Toolset v2.0 reveals significant variations in the expression of discrete miRNA species in a population of single cells from a single phenotype (Figure 3, 4, and 5). Comparison of phenotypically distinct populations (human embryonic fibroblasts, human induced Pluripotent Stem Cells (iPS), human Neural Progenitor Cells (NPC) derived from the iPS, and fully differentiated human neurons (HN)) demonstrate more dramatic differences in addition to the heterogeneity of expression within each group.
Results
Figure 1: Integrated workflow for miRNA analysis in single cells
The C1 Single-Cell Auto Prep System performs Specific Target Amplification (STA) of miRNA transcripts from single cells using the reagents and a protocol developed for this purpose by Life Technologies (protocol “Single-cell MicroRNA expression analysis”). The whole process, from loading the cell suspension on the C1 Integrated Fluidic Circuit (IFC) to full data analysis of the data can be accomplished in less than 24 hours.
Figure 2. C1 MicroRNA STA experimental workflow
Figure 3. Analysis: Single iPS cells and their NPC progeny
A) Unsupervised clustering of the data clearly distinguishes iPS cells from their NPC progeny obtained using small molecules1. Subpopulations are also revealed within each group of cells. B) PCA shows a clear difference between the two phenotypically distinct cell populations. C) Violin plots show differential expression of miRNAs in different subpopulations and reveal the main contributors to Principal Components 1 and 2 (in order from top left to right). The variations in expression of a set of five miRNAs between iPS and NPC shows the same trends as microarray measurements obtained with Embryonic Stem cells (ES) and their NPC progeny (unpublished data, courtesy of Yao Shuyuan).
Figure 4. Human Neurons, iPS and NPC cells
A) Unsupervised clustering of the data obtained with iPS, NPC and mature neurons (HN) clearly distinguishes HN cells from iPS and NPC cells and also reveals subpopulations within each cell type. miR-9 is more frequently and more highly expressed in mature neurons (HN). B) PCA clearly distinguishes between the three cell types based on miRNA expression.The expression of miR-20a, 19b, 17 & 106a is lower in HN, as expected based on neural differentiation and aging data2,3 .
Figure 5. Embryonic fibroblasts at different passage number
A) Unsupervised clustering of the data from two different cultures of BJ embryonic fibroblasts obtained at difference passage numbers (P13 and P24) is not able to distinguish the populations from one another, even though it can reveal different miRNA expression patterns between individual cells. B) PCA analysis of the miRNA expression data from P13 and P24 cells confirms that the two cell populations are undistinguishable based on miRNA expression. C) When the passage numbers are more distant (P7 vs. P24), PCA analysis of the miRNA data (heatmap not shown) distinguishes passage number P7 from P24.
Conclusion
•We have developed a streamlined protocol on the C1TSingle-Cell Auto Prep System to analyze the expression patterns of miRNA species in up to 96 individual cells processed in parallel with minimum hands-on time, in less than 24 hours.
•The C1 miRNA STA protocol uses reagents optimized by Life Technologies for miRNA analysis. In particular, the Megaplex™ pools of RT and PreAmp primers allow to produce cDNA from up to 380 different miRNA species in each cell processed in the C1 IFC. The expression patterns are read out using the Biomark HD System on 96.96 GE Dynamic Array IFCs.
•Unsupervised clustering analysis and PCA of the miRNA data from different cell types reveal different patterns of miRNA expression between the different cell types (confirmed by microarray data or the literature) and also within each cell type.


Copyright(C) 1998-2025 生物器材網 電話:021-64166852;13621656896 E-mail:info@bio-equip.com