Heterogeneity of Single-Cell Gene Expression Across Phenotypically
Multi-cellular populations are fundamentally driven by the collective properties of individual cells. However, our understanding of gene expression dynamics derived from cultures or tissues is based on measurements made from the entire population. A growing body of data collected from individual cells has challenged these basic assumptions. The data suggest that properties driving lineage, development and disease emerge from the transcriptional heterogeneity and signaling architectures of distinct sub-populations of cells. To understand this heterogeneity more fully we performed mRNA transcriptome analysis of single cells across a wide sampling of phenotypically distinct populations. Using an automated platform, the C1™ Single-Cell Auto Prep System, for the capture, lysis, imaging, and routine preparation of full-length mRNA-sequencing libraries of single, live cells we have enabled the delineation of transcriptional heterogeneity within and between cell populations at the level of the individual cell. We present data that compares full length amplified transcriptome profiling by both high throughput gene expression using the BioMark HD System as well as downstream NGS sequencing of prepared cDNA libraries. The data presented here was derived from a wide variety of cell types (>15), including cultured cell lines and from primary cell isolations. In addition, data was collected from both mouse and human cell types, and libraries were generated using several sizes of the C1TM Integrated Fluidics Circuit (IFC), for medium and small cell diameters. mRNA-Seq mapping was conducted using the Tophat v2.0/bowtiev2 and gene expression values were derived using Cufflinks v2. Finally, the single-cell gene expression data was analyzed using Fluidigm’s SINGuLAR™ Analysis Toolset v2.0 to perform outlier identification, principal component analysis, and hierarchical clustering on this wide variety of cell types.
Results
Multi-cellular populations are fundamentally driven by the collective properties of individual cells. However, our understanding of gene expression dynamics derived from cultures or tissues is based on measurements made from the entire population. A growing body of data collected from
individual cells has challenged these basic assumptions. The data suggest that properties driving lineage, development and disease emerge from the transcriptional heterogeneity and signaling architectures of distinct sub-populations of cells. To understand this heterogeneity more fully we performed mRNA transcriptome analysis of single cells across a wide sampling of phenotypically distinct populations. Using an automated platform, the C1™ Single-Cell Auto Prep System, for the capture, lysis, imaging, and routine preparation of full-length mRNA-sequencing libraries of single, live cells we have enabled the delineation of transcriptional heterogeneity within and between cell populations at the level of the individual cell. We present data that compares full length amplified transcriptome profiling by both high throughput gene expression using the BioMark HD System as well as downstream NGS sequencing of prepared cDNA libraries. The data presented here was derived from a wide variety of cell types (>15), including cultured cell lines and from primary cell isolations. In addition, data was collected from both mouse and human cell types, and libraries were generated using several sizes of the C1TM Integrated Fluidics Circuit (IFC), for medium and small cell diameters. mRNA-Seq mapping was conducted using the Tophat v2.0/bowtiev2 and gene expression values were derived using Cufflinks v2. Finally, the single-cell gene expression data was analyzed using Fluidigm’s SINGuLAR™ Analysis Toolset v2.0 to perform outlier identification, principal component analysis, and hierarchical clustering on this wide variety of cell types.
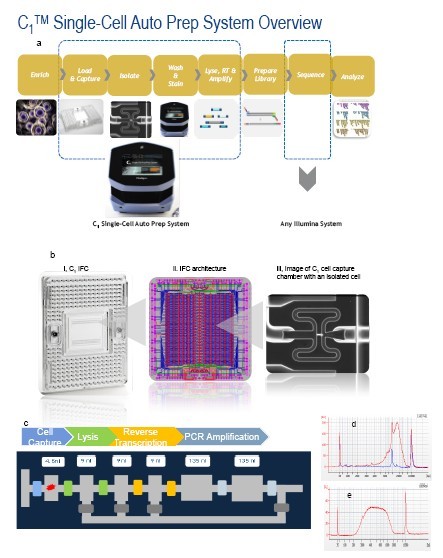
Figure 1. A simplified workflow for the C1 Single-Cell mRNA-Seq application. a) C1 Single-Cell mRNA-Seq Workflow. C1 Single-Cell Auto Prep System automates single-cell isolation, washing, staining, lysis, reverse transcription (RT), and PCR to provide high quality cDNA for further analysis. All the cell handling steps are completed in a C1 IFC. The harvested cDNA is subject to tagmentation and library prep using Illumina® Nextera XT DNA Sample Preparation Kit and is then sequenced on an Illumina sequencer. b) IFC Architecture c) Cell capture module. Each cell capture module can perform up to 5 reaction steps including cell capture, live/dead staining, washing, lysis, reverse transcription, and PCR amplification with active mixing between chambers. d) Bioanalyzer trace of cDNA product obtained from K562 cells (DNA high sensitivity chip). The red line corresponds to cDNA produced from a single K562 cell and the blue line corresponds to a reaction chamber with no cell captured. The 800 bp peak corresponds to synthetic RNA controls included in the mRNA-Seq workflow. e) Bioanalyzer trace of one library pool generated from 96 individual cells by Nextera® XT sample prep kit without size selection and two rounds of cleanup by solid-phase reverse immobilization (SPRI).

Figure 2: Verification of C1 Single-Cell mRNA-Seq data quality. a)ERCC RNA Spike-In Control Mix 1 was applied to a C1 IFC at a total transcript input of 1.4*106 copies/reaction and was then subjected to RT-PCR by both STA and mRNASeq chemistries. There was a high correlation (R2 = 0.92) between the STA data and the mRNASeq data as assessed by qPCR on the BioMark HD System. b) The mRNASeq cDNA was converted to sequencing libraries using Nextera® XT tagmentation and these libraries were then sequenced on MiSeq. The resulting data was mapped using tophat/cufflinks. The log2(FPKM) values showed a high correlation to qPCR data derived from the same cDNA (R2 = 0.92) c) Correlation of RPKM values with transcript input concentration. The RPKM value for each transcript is the average of 96 harvest samples. d) Variation and positive rate of ERCC transcripts. The coefficient of variation and detection rate for each ERCC transcript across is plotted vs input amount (n=96). The positive rate of each ERCC transcript represents number of samples with >10 RPKM. At the sequencing depth used here, we observed dropouts at spike loads below ~50 copies per C1 reaction line. e) The number of transcripts detected (cutoff of RPKM >1) were plotted as a function of read depth for single-cell libraries generated both on-chip and in a 96-well plate, with single K562 cells delivered to the plate by FACS (n = 3 for both chip and plate). A slightly greater transcript diversity was observed in the chip-derived libraries. f) Pairwise correlation plots for the same single-cell libraries sequenced at different depths (3 single cells, sequenced at both 3M and 20M reads). While there are more dropouts of low expression genes at the lower sequencing depth, the correlation is excellent between the same single-cell libraries read at different depths (R2 = 0.99) g) Comparison of aggregated data collected from single cells on the C1 System to matching population tube control data, showing high correlation between the two data sets (R2 = 0.94).
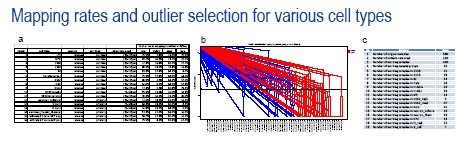
Figure 3: Basic evaluation of single-cell mRNA Seq data quality from the C1 System. a)The table describes the various cell types evaluated on the C1 System and demonstrates that high mapping rates were obtained from cell lines and primary cells, derived from both human and mouse. Note that while the average and maximum mapping rates are good for all cell types, there are outliers with very low mapping rates that are present in many of the groups. b) A plot from the SINGuLAR Analysis Toolset v2.0 demonstrating outlier selection based on GEx distributions of that sample (in comparison to the rest of the sample group). Here, the default settings were used to remove samples with average GEx values (across all genes) that were less than 15% of the average GEx values for the entire sample group. The outliers selected by this automated method agree closely with those selected manually based on mapping rates and total read numbers (20 of 20 samples that were manually identified were also identified by the SINGuLAR toolset). c) The table shows the total number of samples that were retained for further analysis after outlier selection.

Figure 4: PCA of selected human samples and genes a). Principal components analysis was applied to data derived from the 440 single-cell libraries selected after outlier removal. Cells within a given cell type are largely grouped together, with blood cells (K562, HL60, CRL-2339) clustering closely together with positive PC2 scores, and keratinocyte, BJ fibroblast, CRL-2338 (breast cancer), and HeLa cells grouped together with negative PC2 scores. iPS cells, neural progenitor cells, and other neural cell types are spread widely along the PC1 axis with PC2 scores near zero, suggesting that PC1 describes much of the variation associated with neural development and differentiation. b). The top 20 genes contributing to PC1, PC2, and PC3 are listed, with genes contributing to both PC2 and PC3 highlighted in red text. c). Violin plots (combined box plot and probability density plot) are shown for each of the cell groups for the 50 genes that contributed most to the PCA.

Figure 5: Hierarchical clustering of selected human samples and genes a) Hierarchical clustering was performed using the top 50 genes contributing to the PCA. b) The plot shows the Euclidian distance between various cell groups in the hierarchical clustering, highlighting which cell types are most closely related with respect to these top 50 genes.
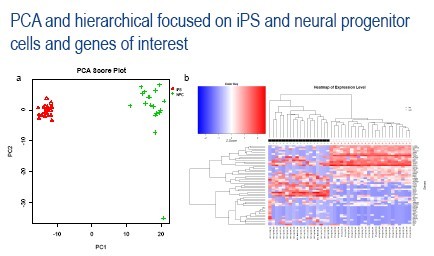
Figure 6: a). PCA was again conducted on the single-cell data from iPS and neural progenitor cells; however, in this analysis only 400 specified genes of interest were included in the analysis. b). The top 50 genes contributing to the PCA were then used to conduct hierarchical clustering, revealing gene clusters that contribute to the differences between these two cell types, and also revealing a unique gene signature in the single neural progenitor cell that was separated from all other cells by the PCA.
Conclusion
•The C1 mRNA-Seq protocol generates full-length cDNA of high quality and enables simple, reproducible, cost-effective sequencing library preparation from individual cells derived from a wide variety of tissues and cultures.
•The data produced by this system is quantitative and reproducible, as demonstrated using ERCC spike-in controls and by reassembling population data using aggregated single-cell data.
•Principal component analysis and hierarchical clustering of the resulting mRNA Seq data performed Fluidigm’s SINGuLAR Analysis Toolset v2.0 accurately classifies >400 single cells into multiple distinct clusters. The analyzed data reveals a broad spectrum of transcriptional heterogeneity within nominally homogeneous cell populations.